Q wavetables
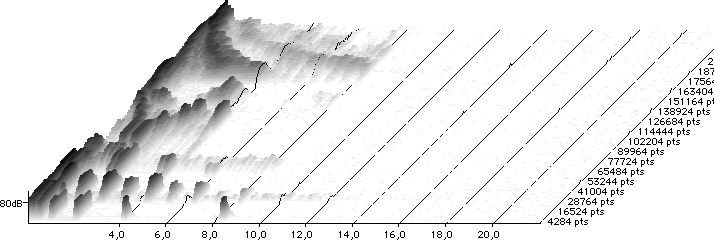
Ich habe die Wellensätze des Waldorf Q's gesampled und eine FFT erstellt.
Es wurde kein Filter eingesetzt. Die Amplitude ist nicht linear dargestellt. Die Frequenzachse (x) ist wie bei den meisten FFT Graphiken linear skaliert und geht hier von ca 88Hz bis knapp über 22 kHz.
I sampled the two wavetables of the Waldorf Q and did a FFT to show the harmonic content.
No filtering was used. The amplitude is not shown linear. The frequency axis (x) is linear scaled as on most FFT charts and starts at 88 Hz and goes up to a little bit more than 22 kHz.
Links sind die tiefen Frequenzanteile.
Vorne die niedrigen Wellennummer.
Je höher und dunkler die Fläche ist, desto stärker ist dieses Frequenzband.
On the left are the deeper frequencies.
In the front are the lower wave numbers.
The area is getting higher and darker on stronger frequency bands.

Alt 1

Alt 2
| Andere wavetable-Seiten: Other wavetable pages: | Wellensätze 1-30 Wavetables 1-30 | Wellensätze 31-64 Wavetables 31-64 |
Waldorf Q
all pictures ©2000 by Till Kopper [ich (a) till - kopper (.) de]